Uptime Kuma is an open-source monitoring platform designed to help you track the availability and performance of your online services.
With its user-friendly interface and customizable alerting system, Uptime Kuma provides real-time insights allowing you to proactively address issues and minimize downtime.
Uptime Kuma is a reliable choice for anyone seeking a comprehensive and robust monitoring solution …so what are you waiting for?
Requirements #
For this simple yet powerful application all you really need to follow this tutorial is Docker / Docker Compose.
Installation #
Create the installation directory for Uptime Kuma, in my case
/opt/uptime-kuma.
mkdir /opt/uptime_kuma
Generate the docker-compose.yml in the next step.
version: "3.8"

services:
  app:
    container_name: uptime-kuma
    image: louislam/uptime-kuma:1
    restart: unless-stopped
    volumes:
      - uptime-kuma:/app/data
    ports:
      - "<PORT>:3001"

volumes:
  uptime-kuma:
    driver: local
<PORT>.
Start your container with
docker-compose up -d`.
How does it work? #
Access Uptime Kuma via https://<YOUR_SERVER_IP>:
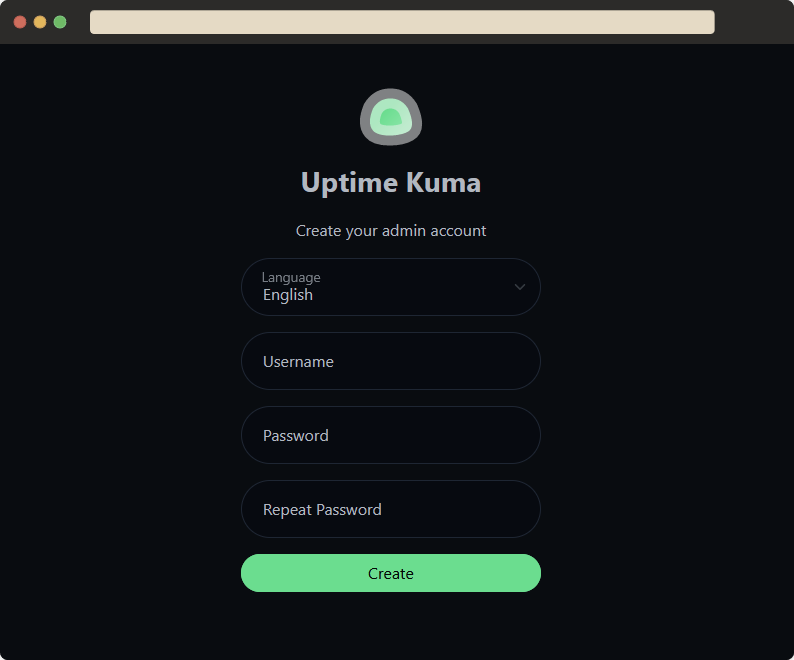
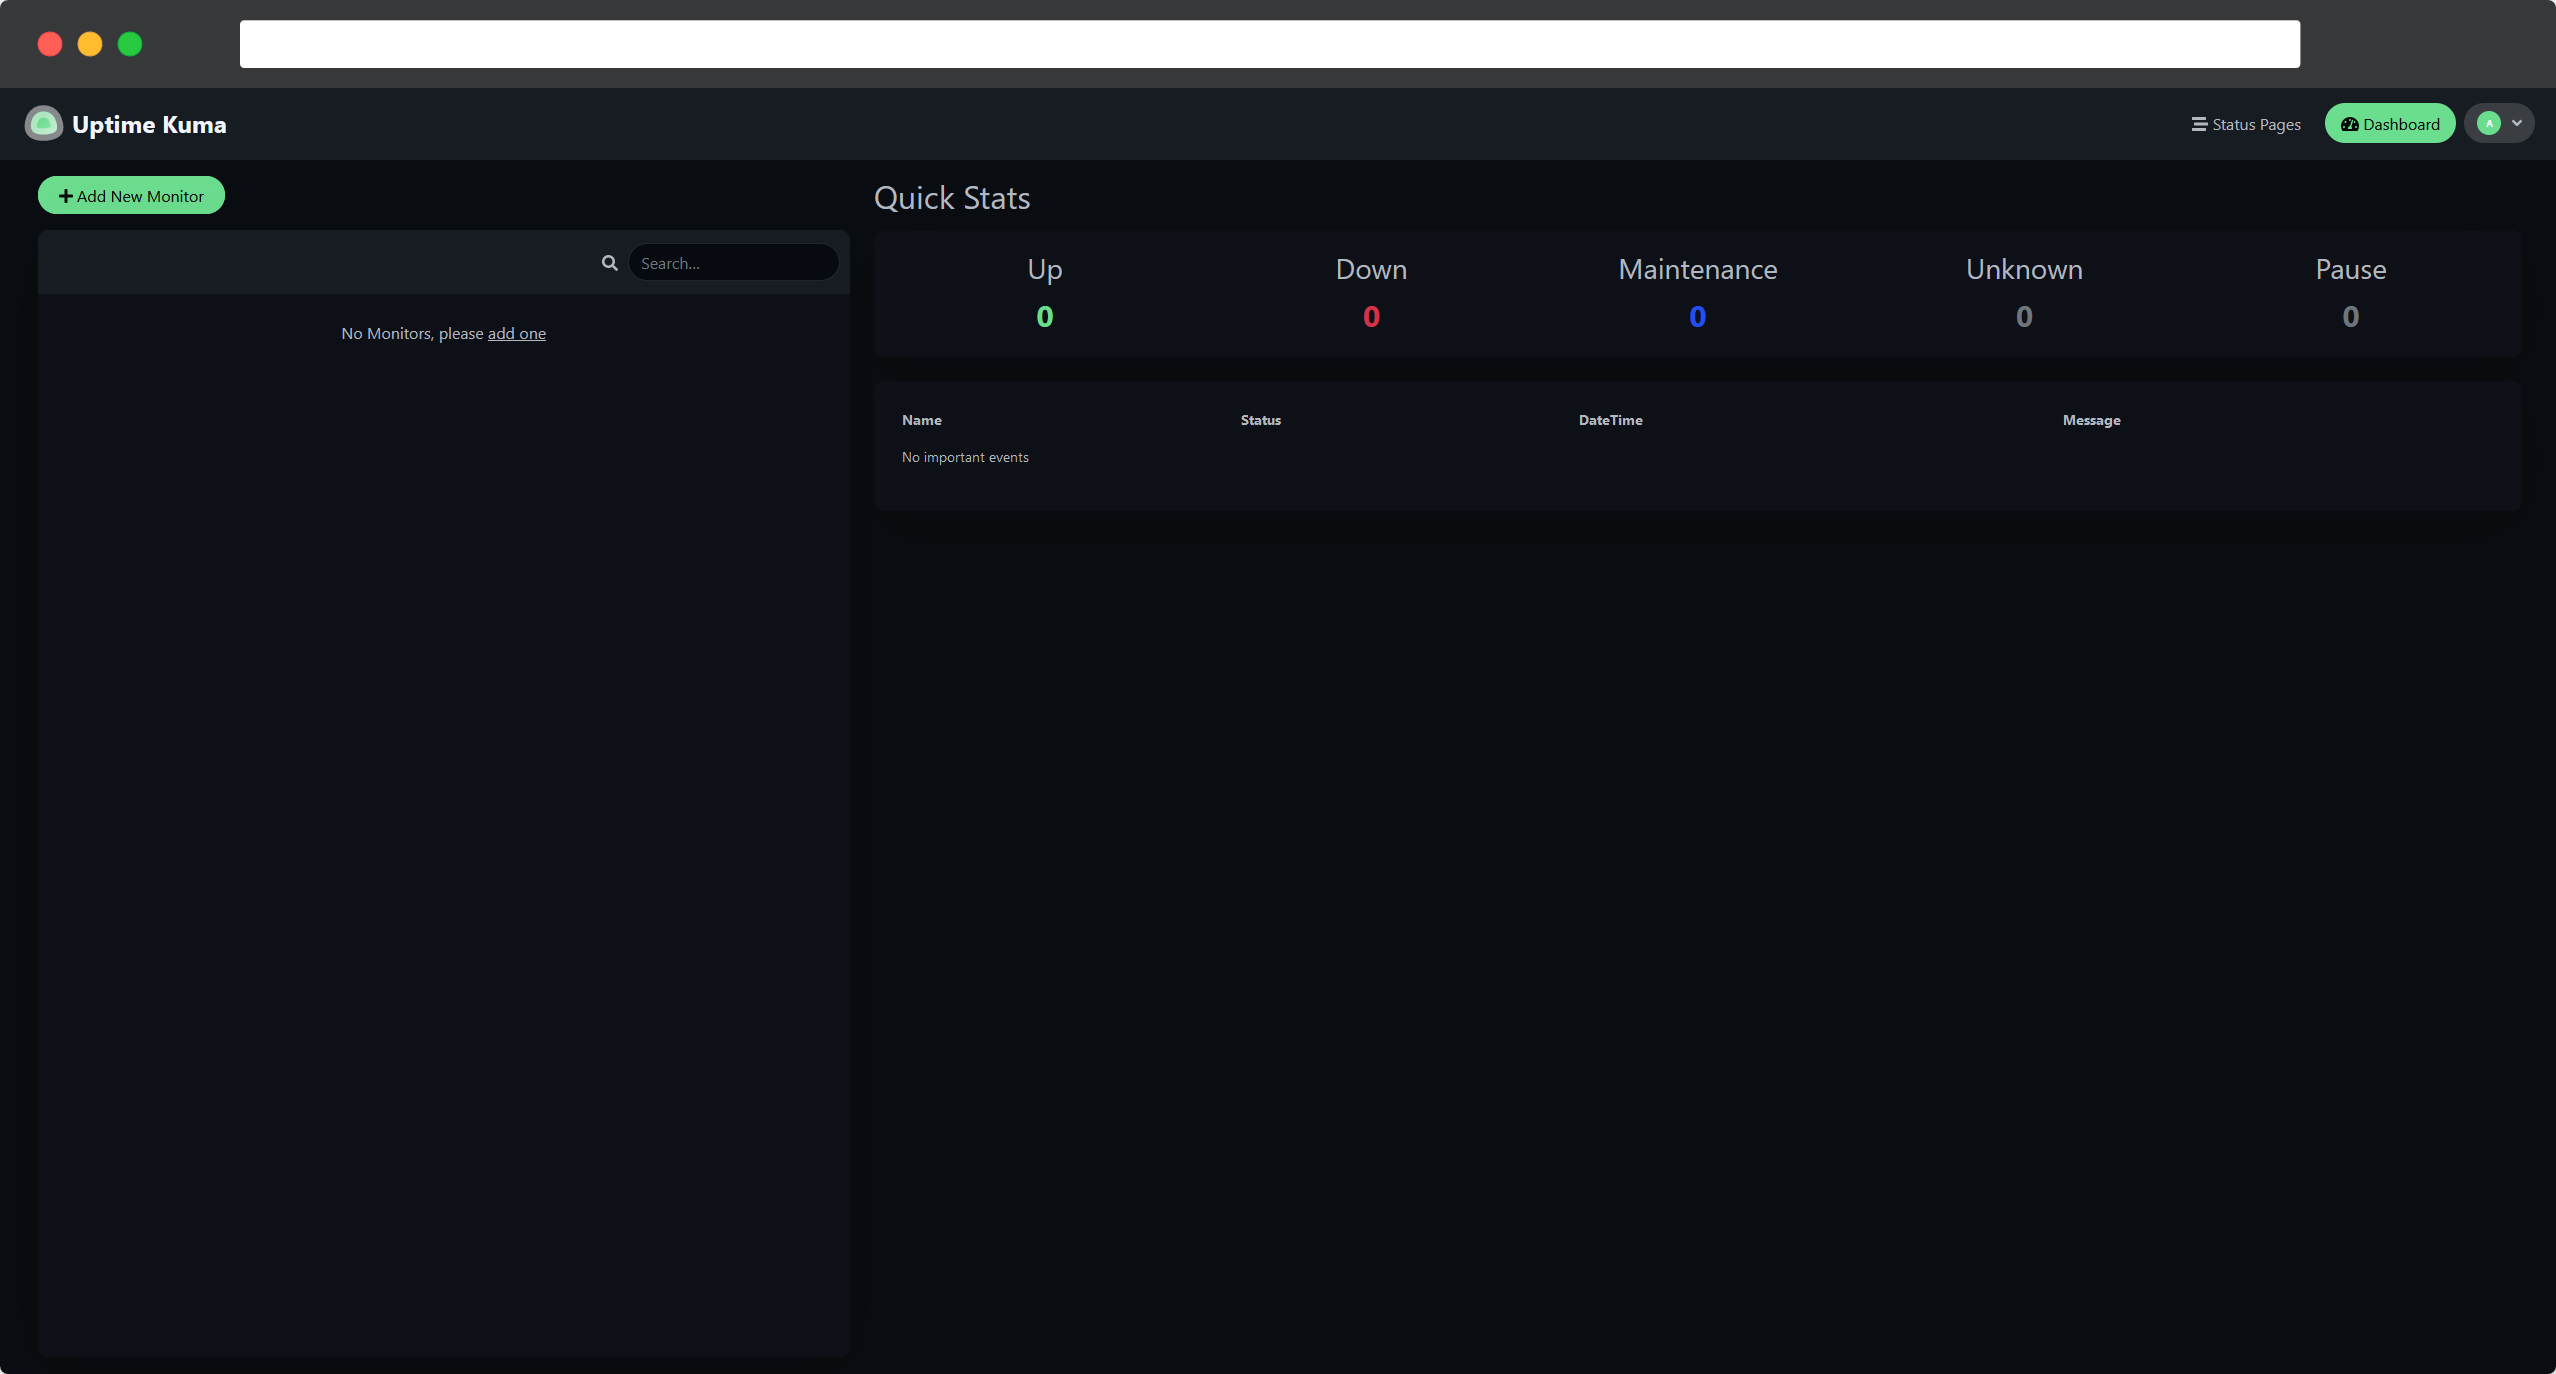
After automatically being logged in as your newly created admin user you will be presented by Uptime Kumas’ (still empty) Dashboard.
Click on Add New Monitor to monitor your first service.
Monitor your Services #
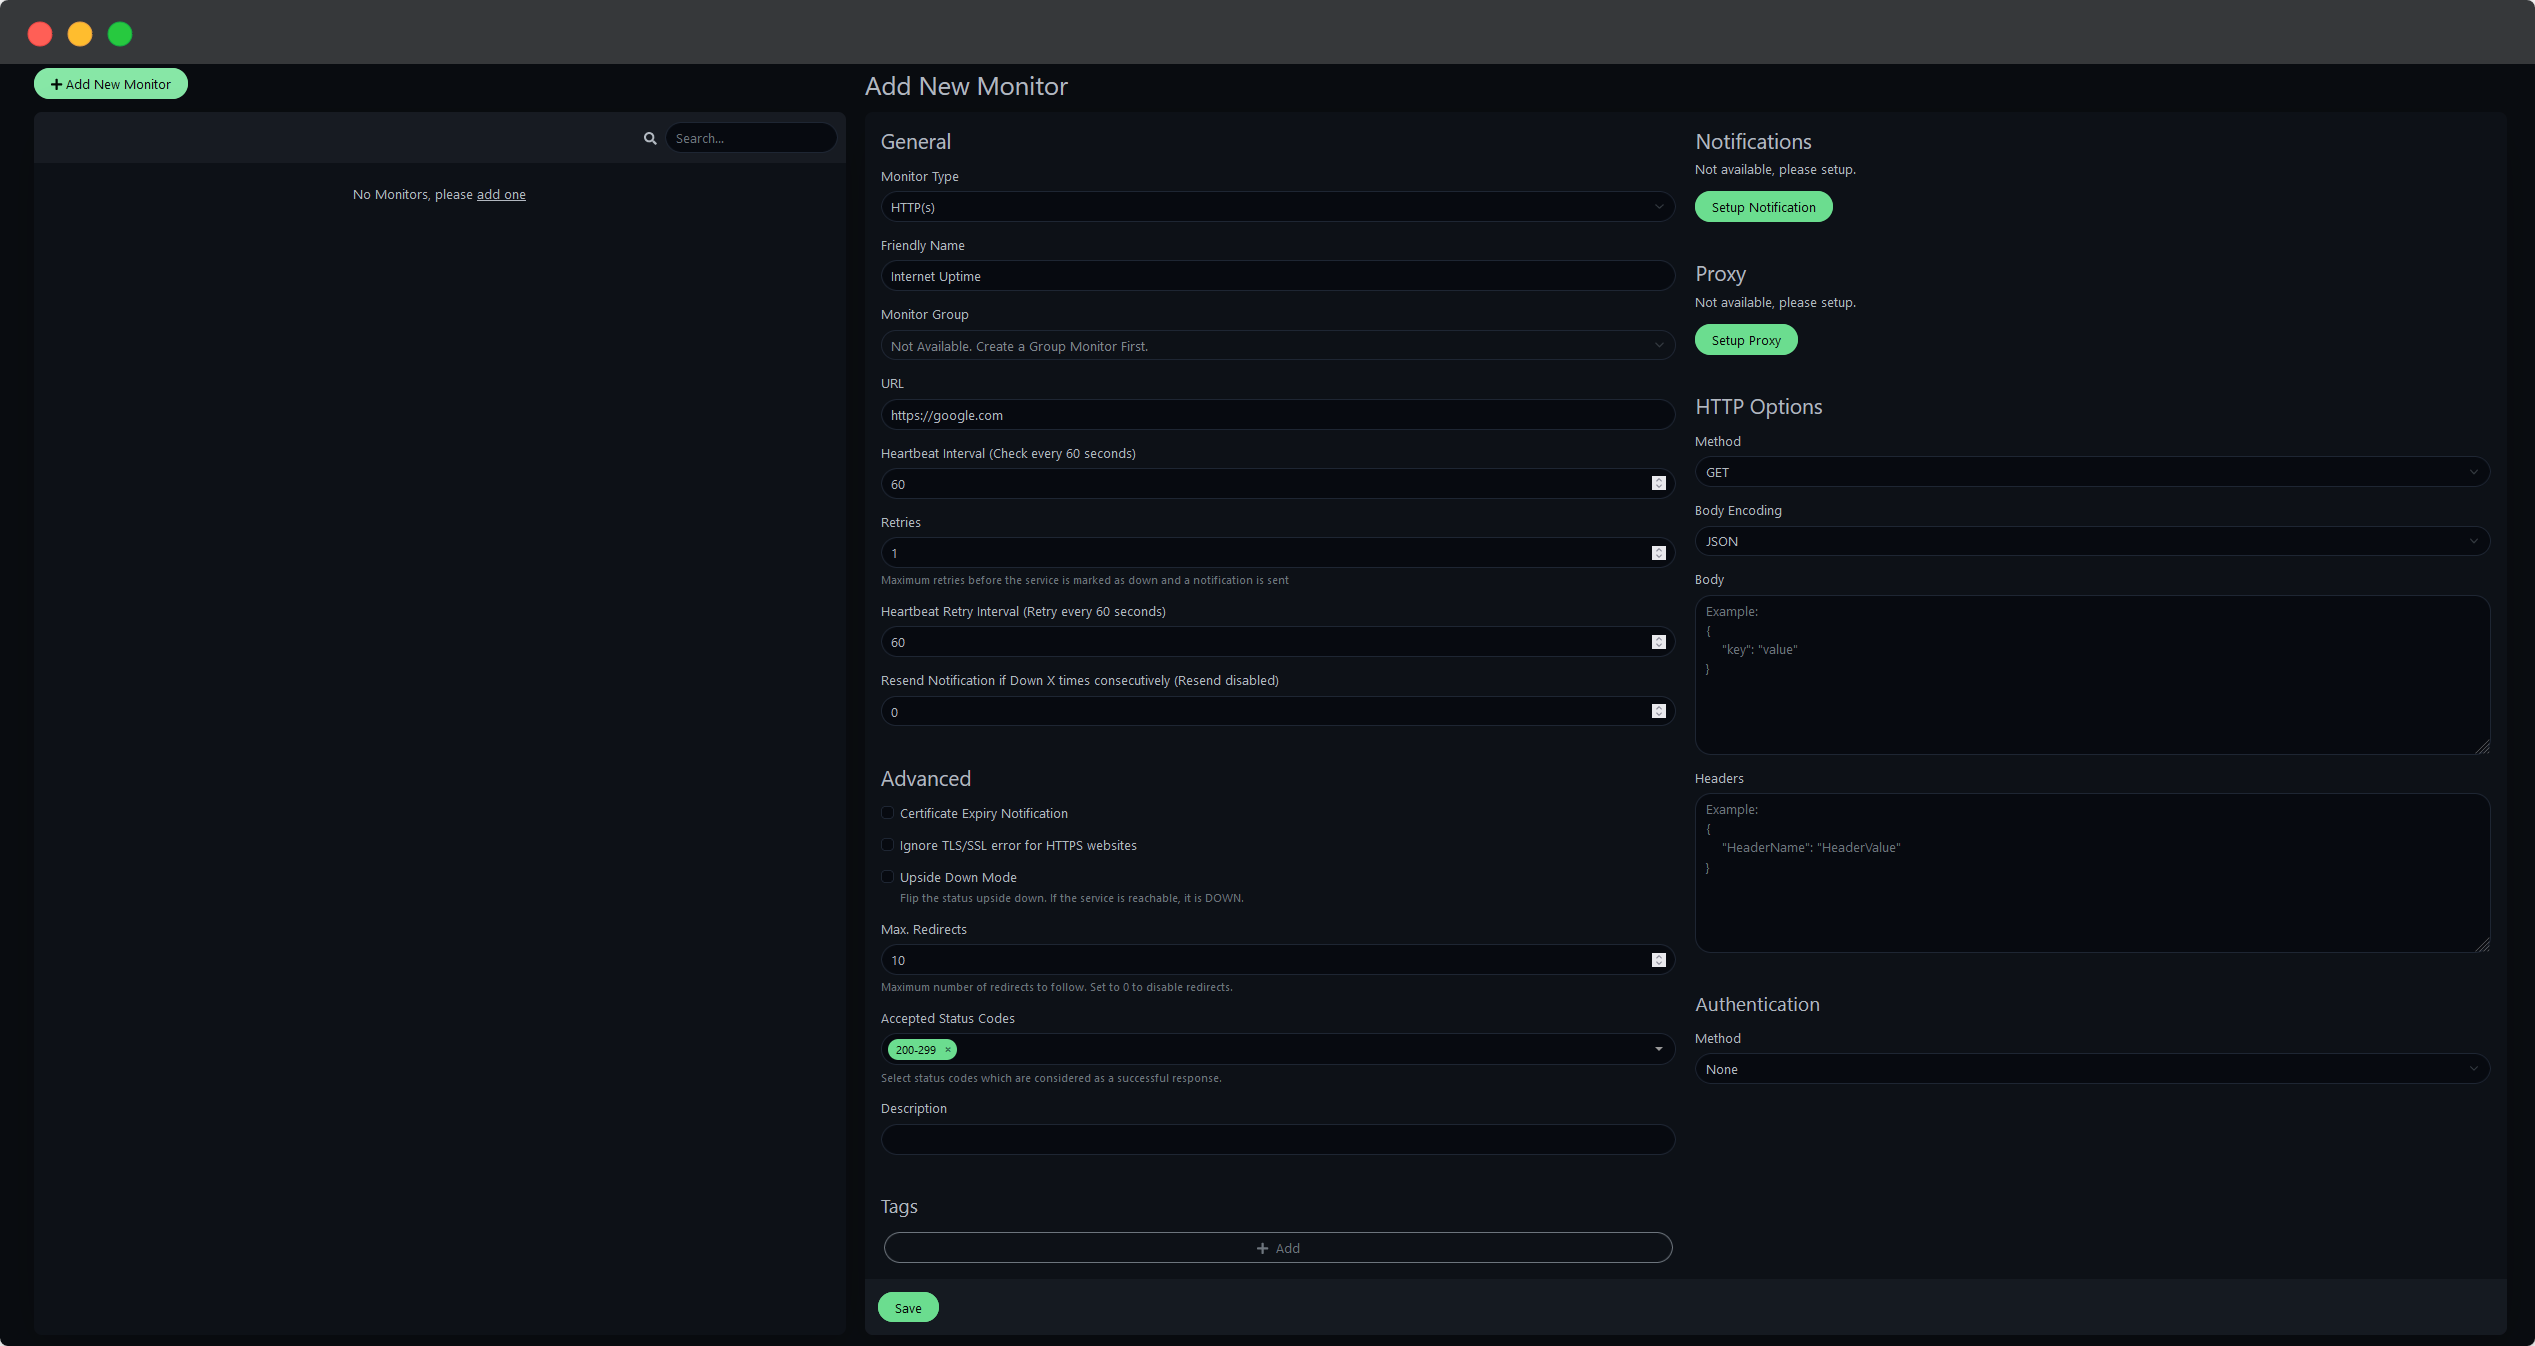
Uptime Kuma supports many different monitoring Types, ranging from a simple Ping to sensors for Docker Containers or DNS monitoring.
We will start off with a quick HTTP(s) sensor of
www.google.com to rudimentary keep track of our internet connection.
We have now created our first monitor which already is collecting data diligently.
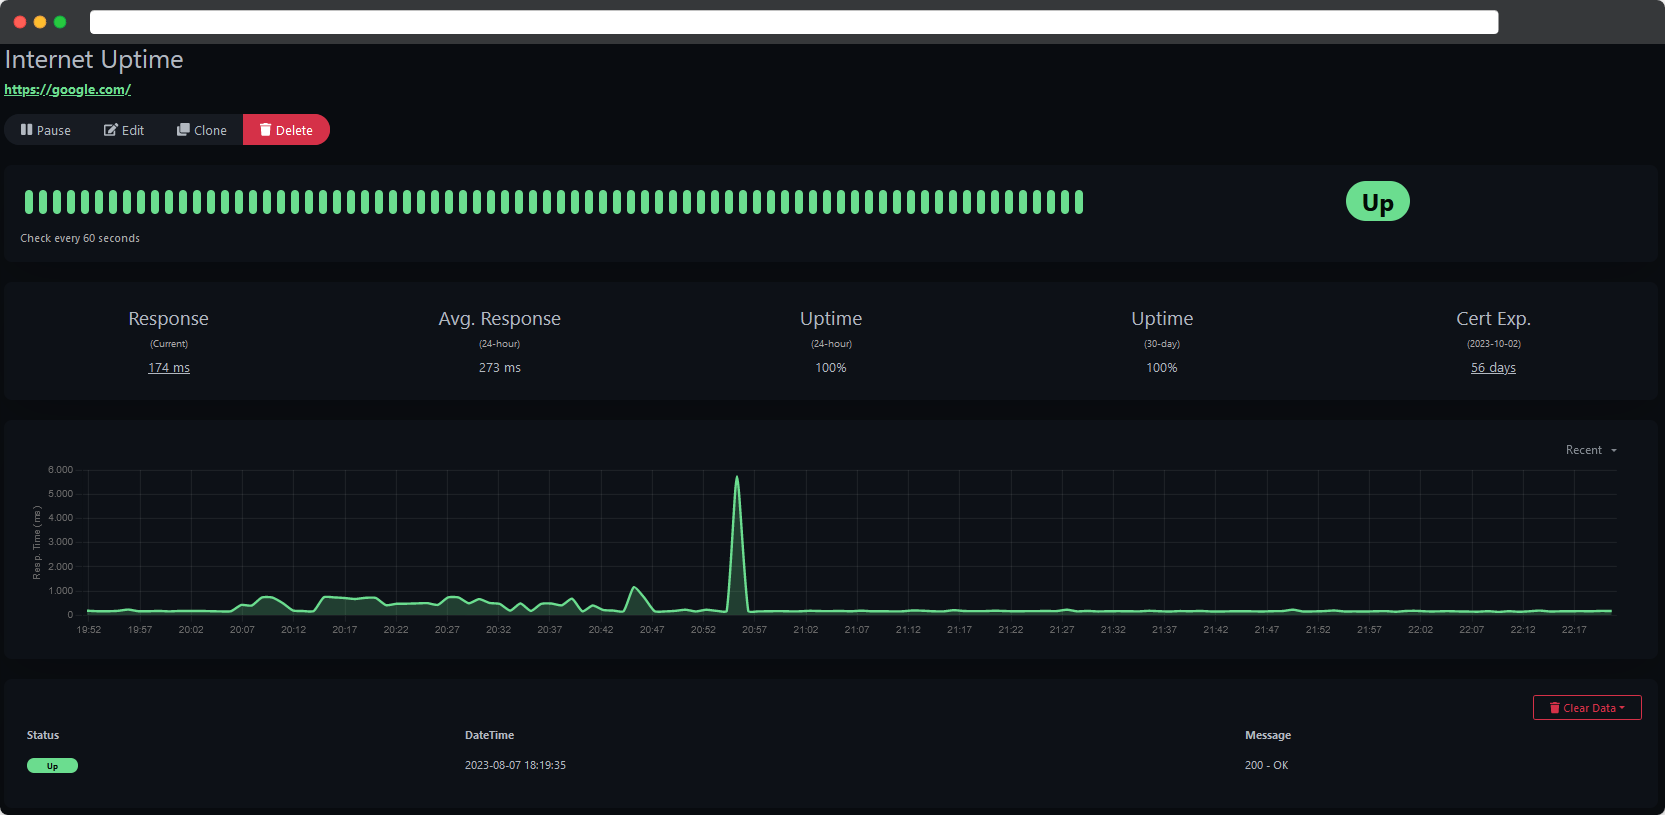
This gives us a chance to manually check for uptime history and statistics but does this really help with noticing problems? How can we stay on top of our ‘homelab game’ and always be the first to notice any trouble regarding our self-hosted services?
Setup Notifications #
Uptime Kuma supports a wide range of notification services such asApporise, Telegram or Discord just to name a few. We will be setting up ntfy as notification service, it runs stable across many platforms and I’ve grown to become a huge fan of it.
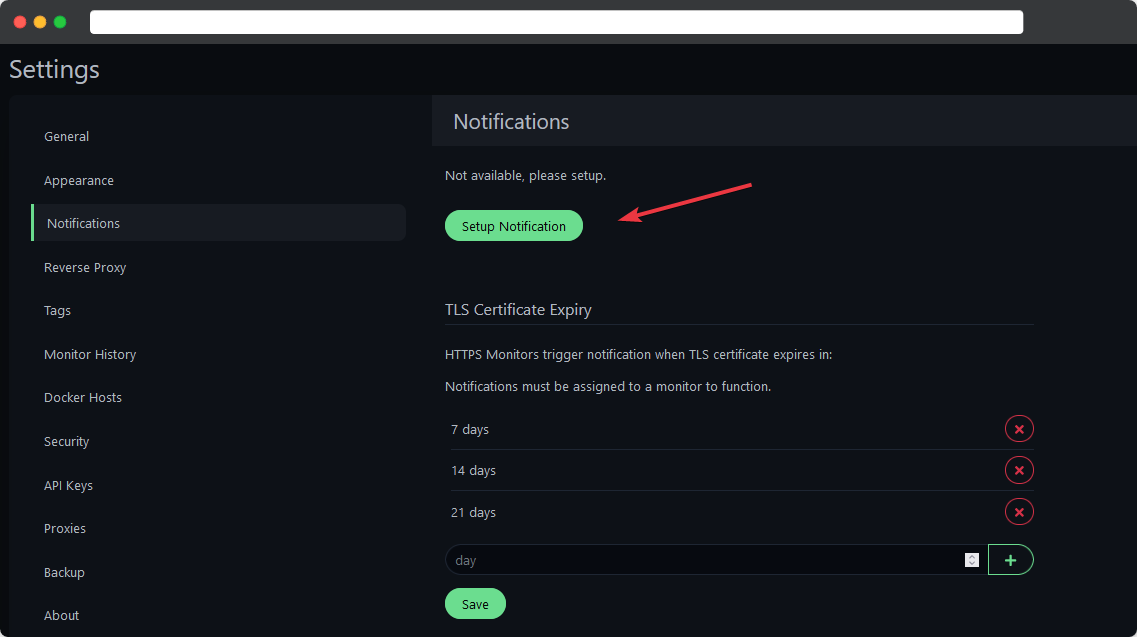
Open the settings in the top right corner drop-down menu, navigate to ‘Notifications’ and ‘Setup Notification’.
Chose Ntfy as your Notification Type set everything up.
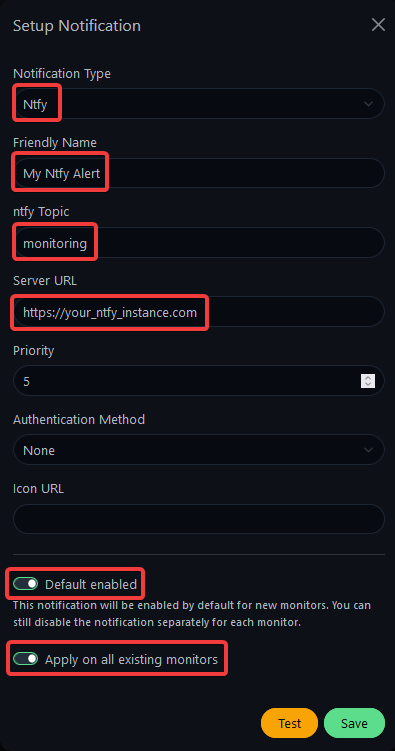
Friendly Name: Pick a name for the notification type.
nfty Topic: This has to be set up in ntfy first.
Server URL: URL of your Uptime Kuma instance.
You can also set this newly created notification type as default and enable it on all existing monitors.
Create a Status Page #
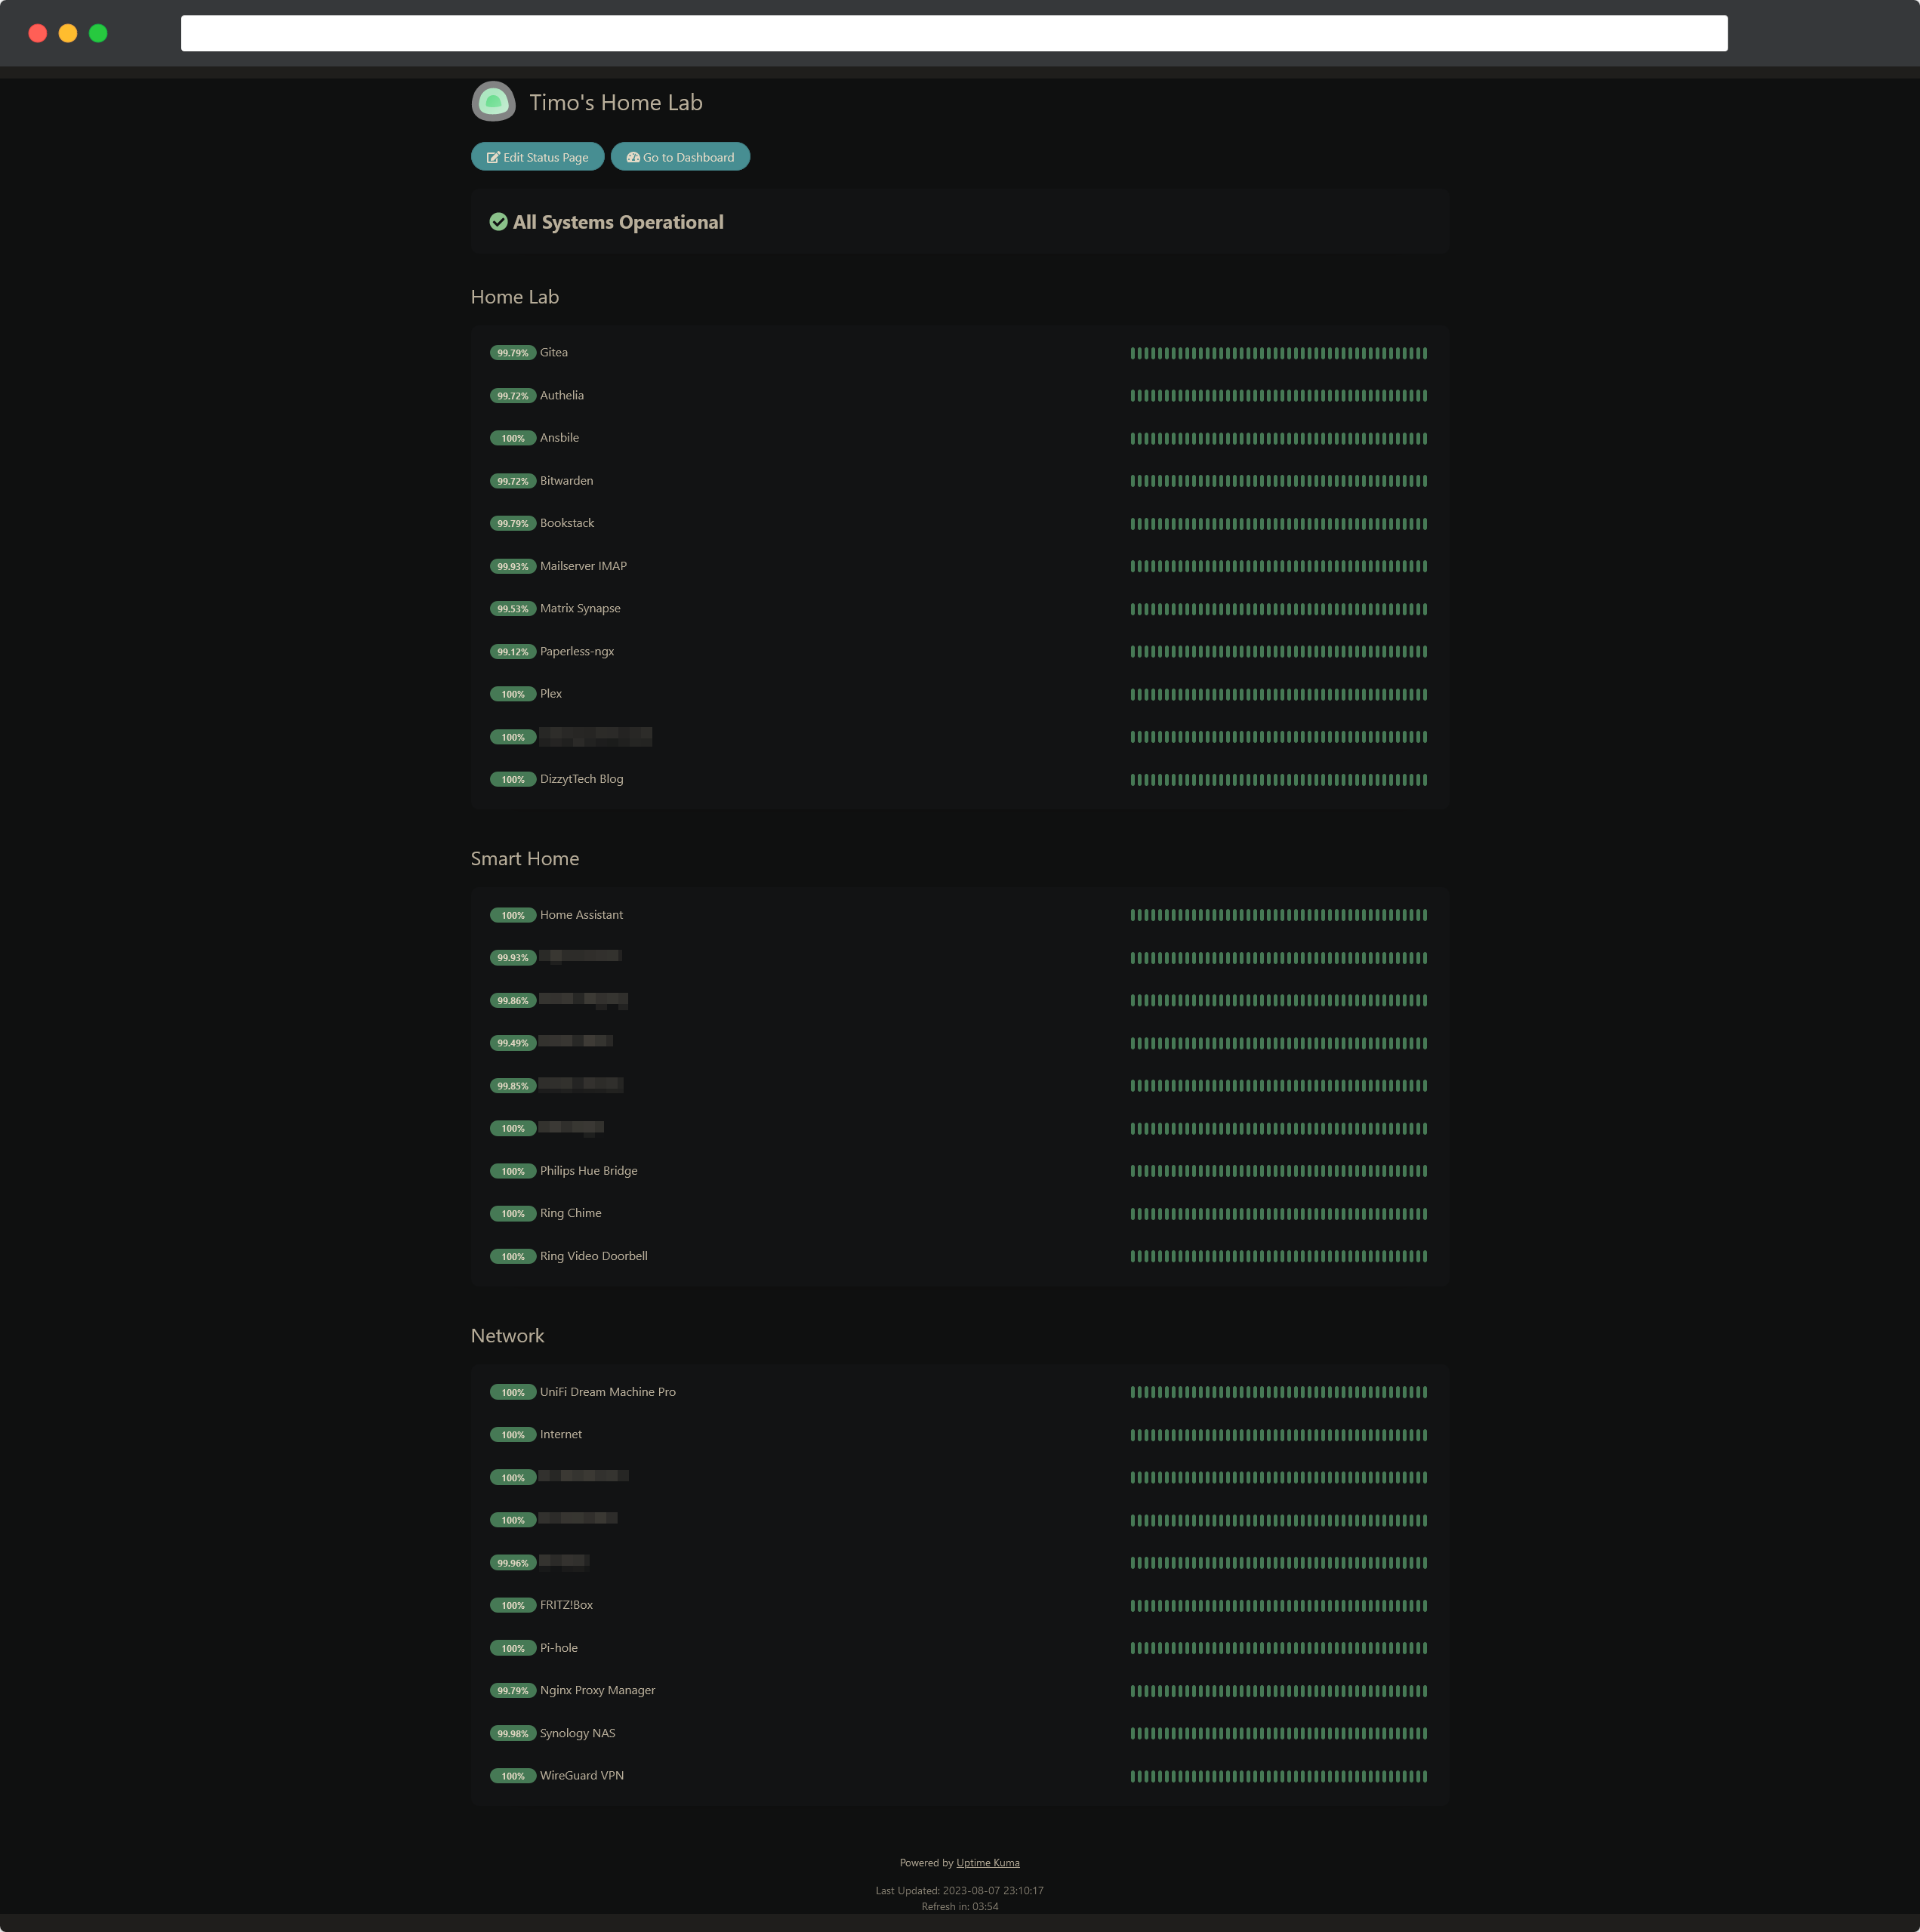
If you need a quick overview of your services, the Status Page is the way to go.
Click on Status Pages in the Header of Uptime Kumas’ Web GUI and add a New Status Page

Now give your Status Page a name, a descrption and add your newly created monitor Internet Uptime.
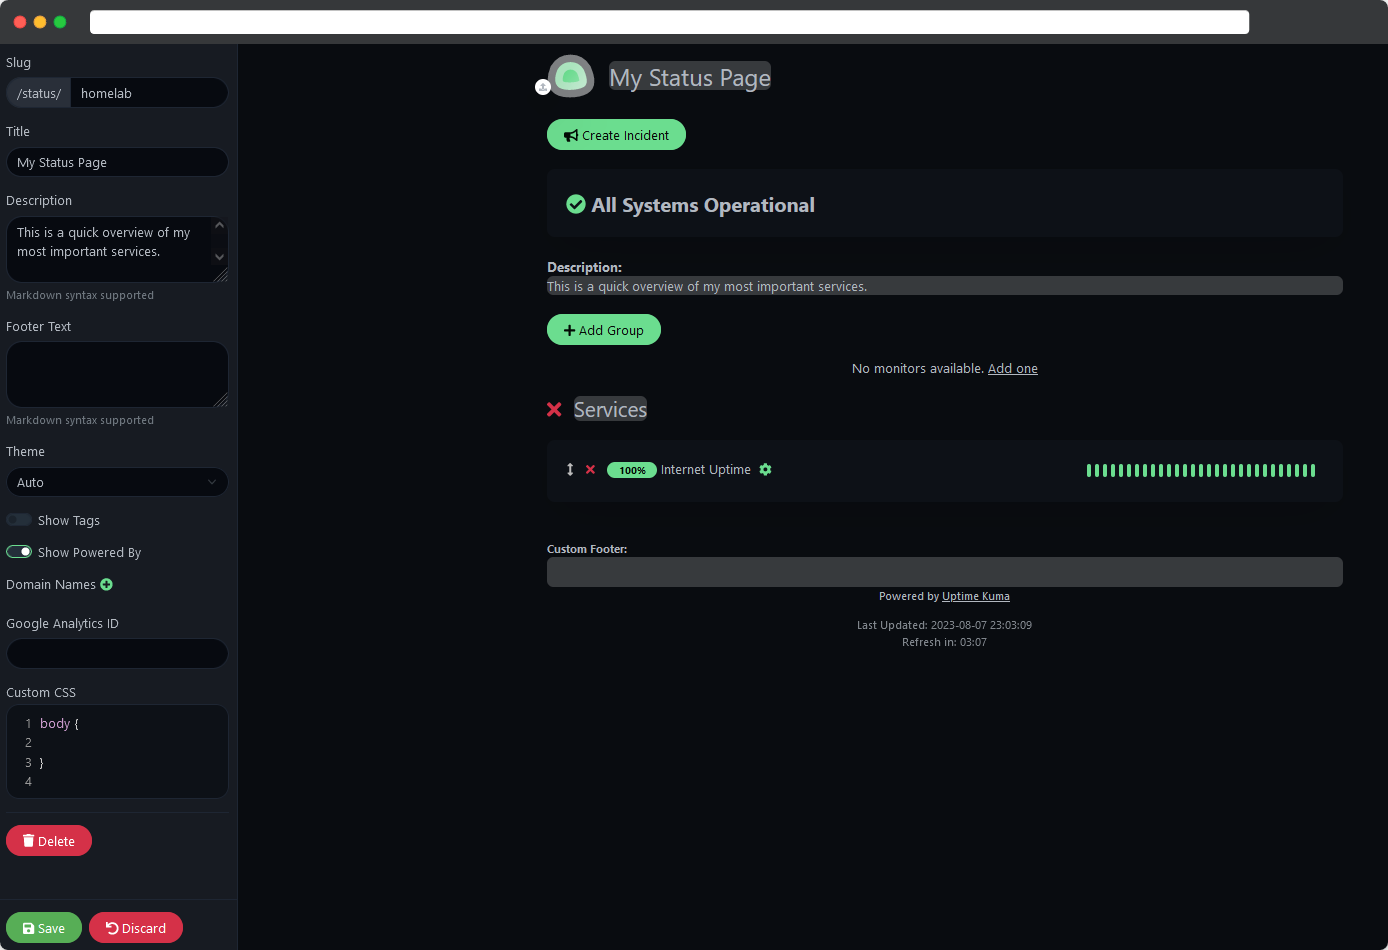
This gives you a good and quick overlook of all your monitors.
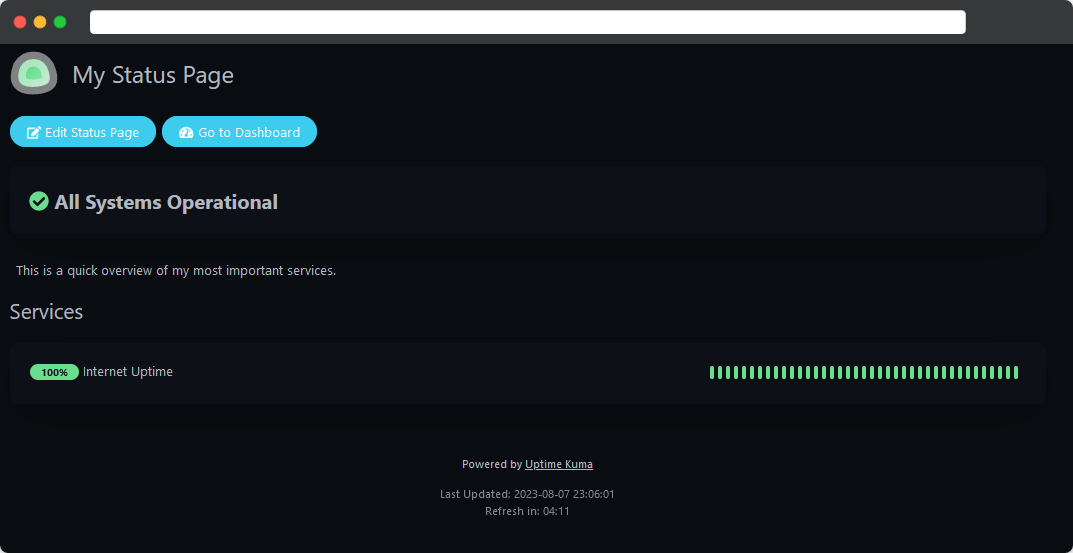
Internet Uptime.
Of course this is highly scalable and you can add as many monitors as you wish, you can even group them and add tags.
Final Thoughts #
The comprehensive monitoring and notification options paired with the simple setup process makes Uptime Kuma one of my favorite homelab tools, I’m using it for quite a while now and without it I’d feel blind.
Uptime Kuma just works and I never even considered going on the lookout for another monitoring solution.
Try it out and I promise you will sleep even better with this proper monitoring solution 😉.
Consider leaving a ⭐ at the GitHub Repo if you like Uptime Kuma.

